Analytics Dashboard
Real-time data visualization for enterprise teams.
View Live Demo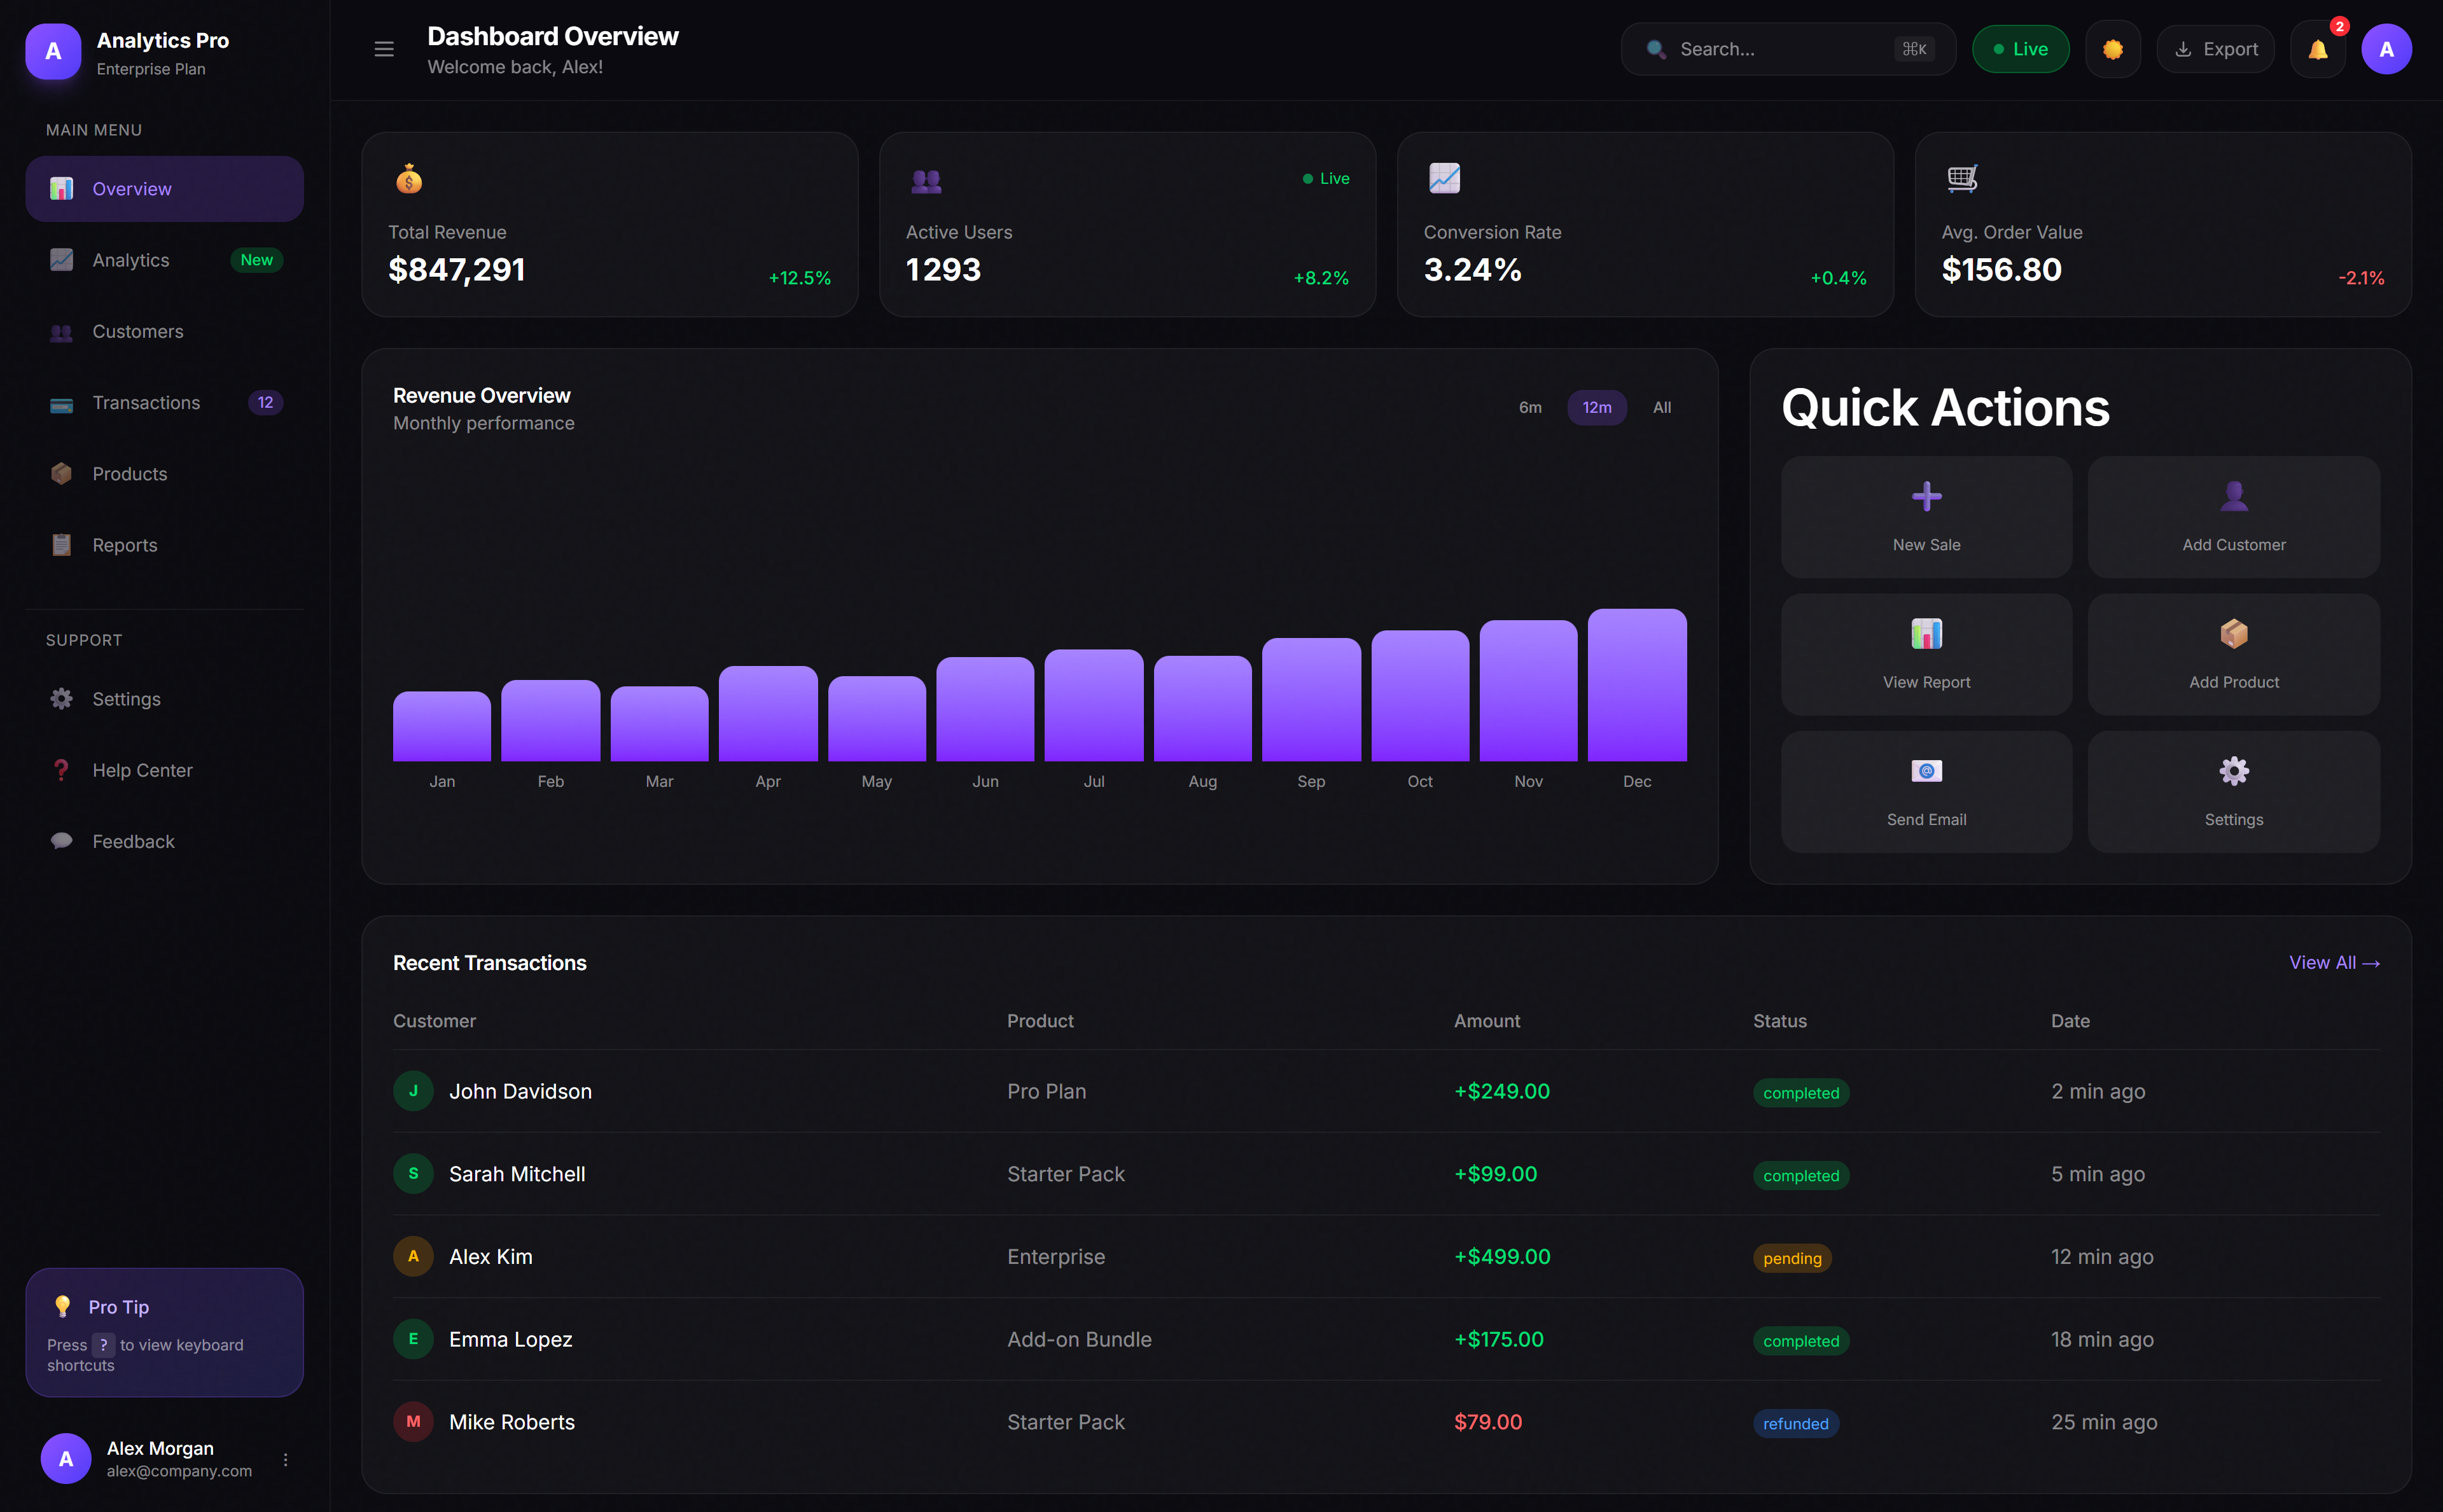
Client
Enterprise Analytics Company
Year
2025
Duration
4 months
Role
Full-Stack Development & UI Design
The Challenge
Our client needed a powerful analytics platform that could handle real-time data from millions of events while remaining intuitive for non-technical users. Their existing solution was slow, visually outdated, and required constant training.
Our Solution
We built a custom dashboard using Next.js and D3.js that processes data in real-time with WebSocket connections. The interface features drag-and-drop widgets, customizable views, and AI-powered insights that surface important trends automatically.
Technologies Used
Key Features
Results & Impact
+340%
Data Processing Speed
95%
User Adoption
-60%
Training Time
4.9/5
Customer Satisfaction
“Pulse Studio Lab transformed how we interact with our data. The dashboard is not just beautiful—it's genuinely changed how we make decisions.”
VP of Product
Enterprise Analytics Company